|
September 10, 2026
|
|
Hi builders! We’re excited to share new features for ARIA, AI Research and Iteration Agent in Weights & Biases, including project memories and automations. We’ve also improved how you explore visualizations with new Band and Line views and help you align x-axis values. Give these new features a try!
|
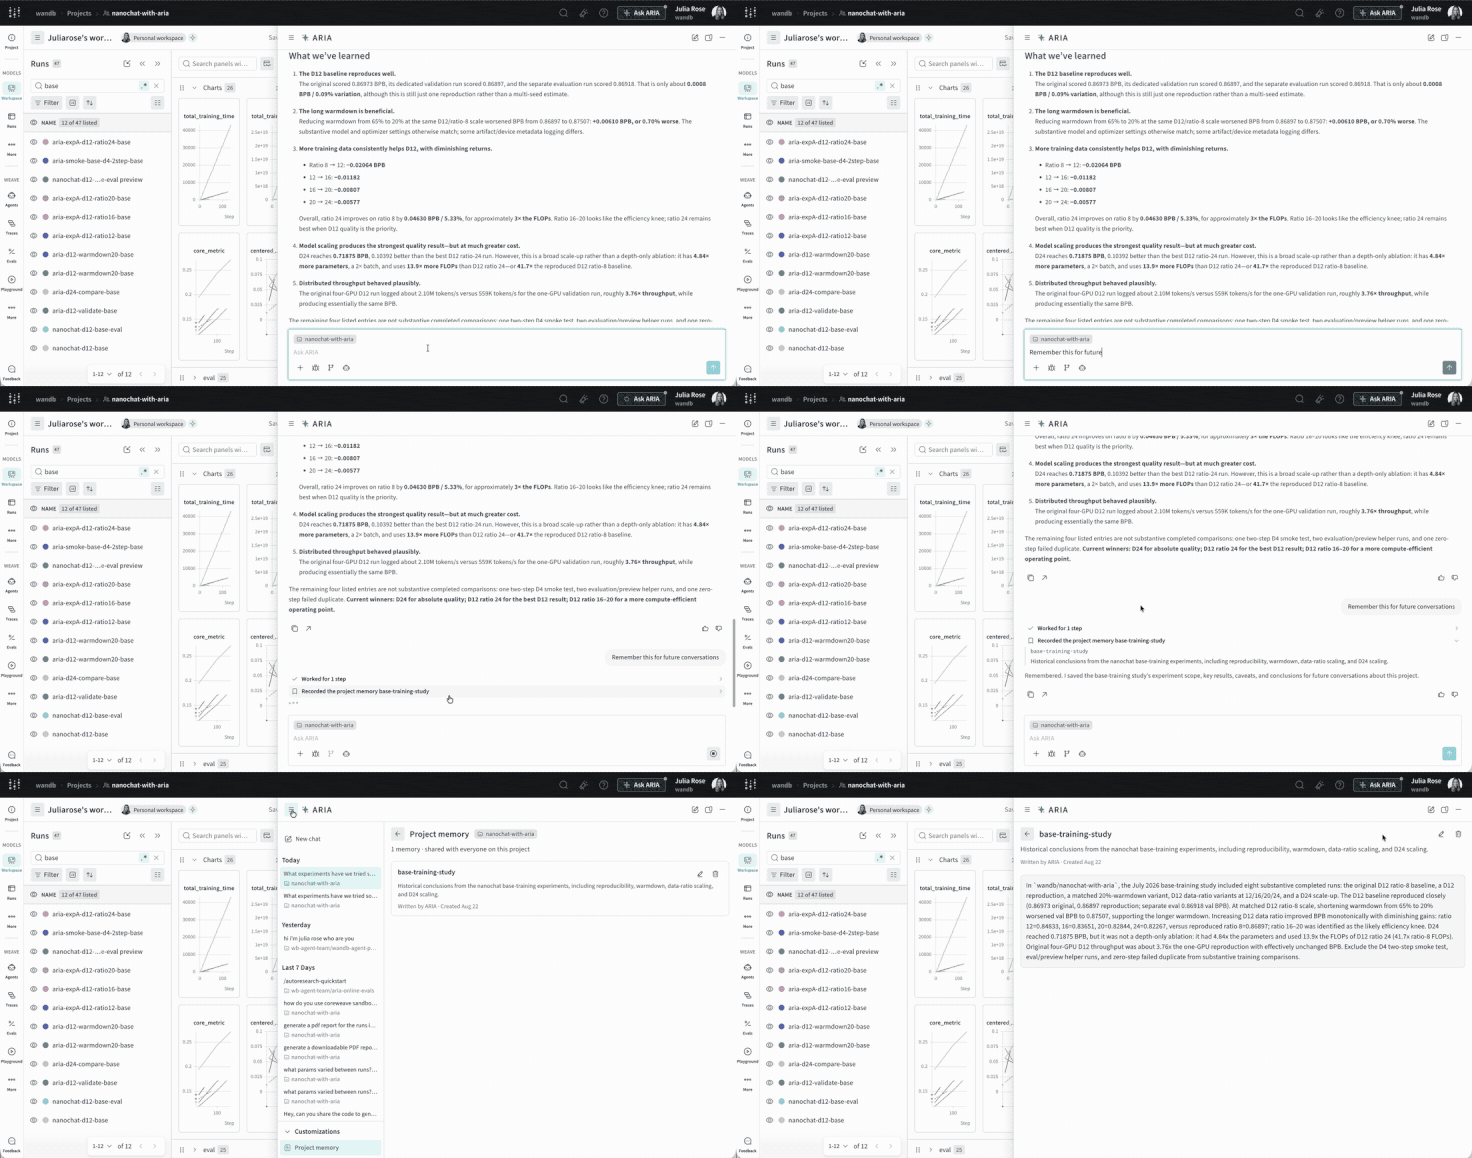
New: Project memories in ARIA
|
|
ARIA captures important project context, including key runs, experiment findings, and the decisions you made. Now when you return, ARIA remembers what you learned, so you can pick up where you left off without re-explaining your setup or preferences. Your team can view, edit, or delete project memories from the Customization tab in the ARIA sidebar. Try it now!
|
|
New: Create automations with ARIA
|
|
Simply describe the automation you want in natural language, and ARIA will create and enable it for you. ARIA is now closing the self-improving training loop by evaluating results when a run finishes, automatically launching a new run, and continuing iterating until your target metric is reached. Try it now!
|
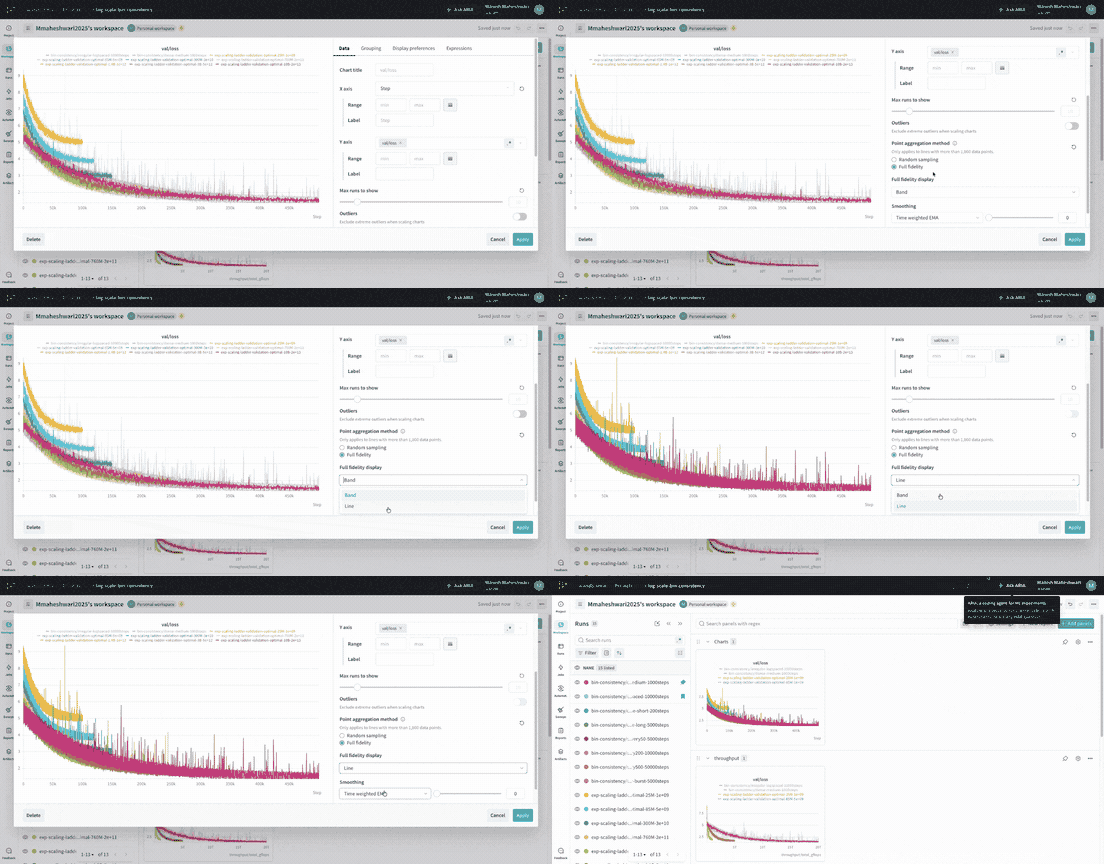
New: Spot spikes and dips with Line and Band views
|
|
Full-fidelity line plots now capture the minimum, maximum, and last value in each x-axis bucket, making important spikes and dips easier to see. Choose Band view to visualize the min/max range as shading around the overall trend, or Line view to connect values directly and surface variations more clearly.
|
|
New: Compare runs with aligned x-axis values
|
|
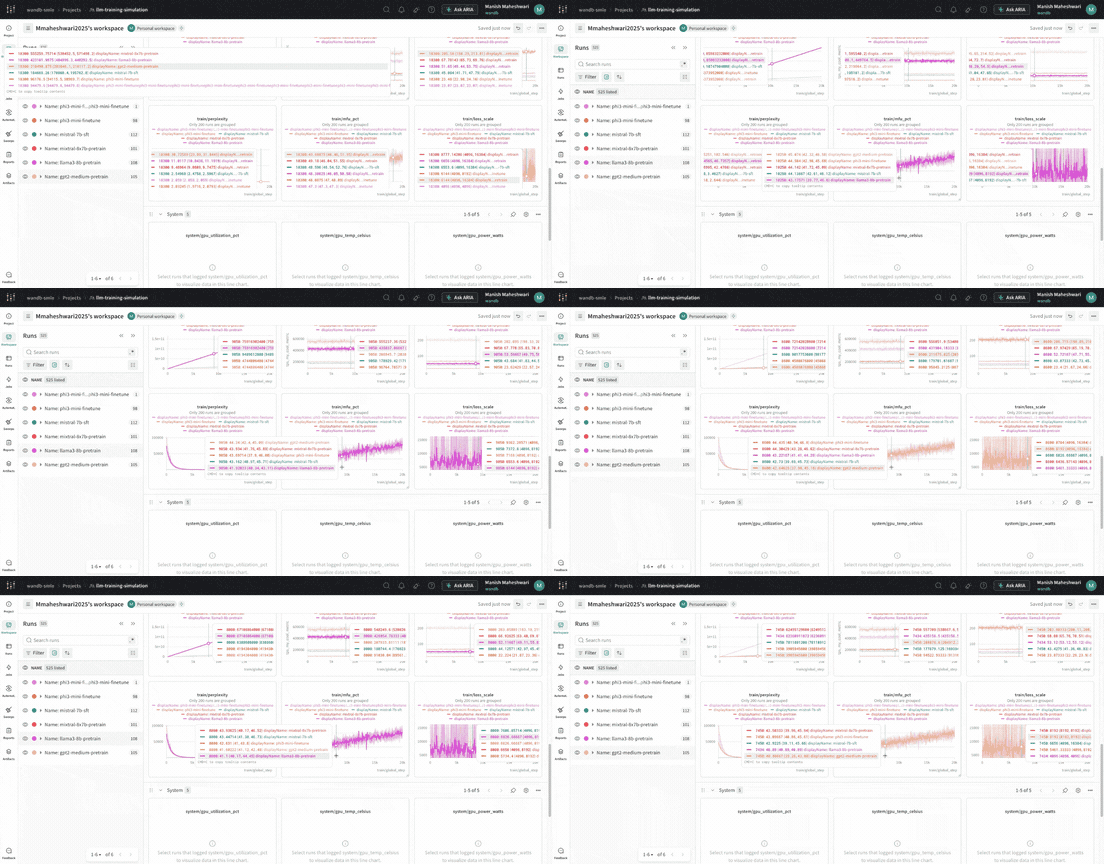
Line plots now use a shared x-axis scale across all runs, making hover comparisons more consistent and accurate. When runs log a metric at the same step, hovering displays the same x-value for each one. Runs with different logging cadences may still show different values based on their nearest logged points, but all values now follow the same bucket boundaries for reliable comparison.
|
|
New: View and compare image metrics in runs with W&B iOS mobile app
|
|
Images logged with wandb.Image now appear alongside line plots in the run’s Metrics tab. Scrub or jump between steps, compare multiple images in a swipeable grid, and open any image full screen to zoom, pan, and inspect every detail. You can also star image metrics for quick access. Download the app now!
|
Events & Webinars
|
|
Our next What’s New Wednesday webinar is on September 23. We’ll cover how to vibe-code, trace, and deploy your agents, and give you a quick preview of CoreWeave Hacks and Fully Connected. Join us to explore new capabilities that help AI teams build faster and better understand agent behavior in production.
|
|
Join us at Moscone South in San Francisco for Fully Connected 2026, September 29 – October 1. Hear directly from AI leaders at Cognition, LlamaIndex, Cohere, CrowdStrike, NVIDIA, and World Labs, then get hands-on in engineering labs building autoresearch agents, scaling inference, and red-teaming production models on real CoreWeave infrastructure. Register now with code EmailFC02026 for your complimentary pass.
|
|
That's all for now.
|
|
The Weights & Biases Team
|
|
|
|
|